FINDER Online (maryland.gov)
FINDER Online is a tax map and real property database viewer for the state of Maryland. FINDER Online may be used to query data and generate maps for informational purposes. This manual will guide the user through the application.
The application is maintained by the Maryland Department of Planning.
Usage Recommendations
This site performs best using either Chrome or Firefox browsers.
All FINDER Online functionality is accessible on large, medium, and small screen sizes.
Keyboard Navigation
Use the following keys to navigate the application using a keyboard.
- General Navigation
- Tab / Shift + Tab: Navigate between elements (panels, widgets, and settings).
- Arrow Keys: Navigate within a selected element.
- Enter / Space: Select a focused item, expand a menu, or activate a button.
- Esc: Close a dialog box, menu, or exit a dynamic list.
- Map Navigation
- Arrow Keys: With the map element selected, pan the map view.
- Plus (+) / Minus (-): Zoom in and out.
- A / D Keys: Rotate the map.
- N: Rotate map to the default orientation (north facing up)
Application Layout
Splash Screen
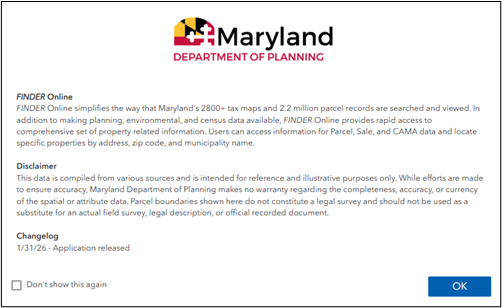
When opening the app, you will see a splash screen with a brief introduction to the application. The changelog shows a record of updates made to the app and data. Optionally, you can check “Don’t show this again” to hide the splash screen in future sessions. Click OK to continue to the application.
Page Overview
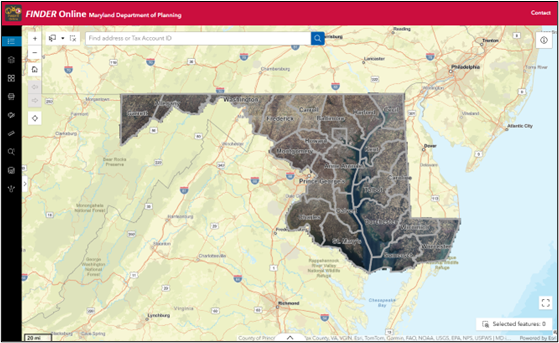
The appearance of the application may vary depending on the screen size of the device you are using.
Header
The header of the applications contains several elements. The Maryland Department of Planning hyperlink directs you to the MDP website. The Contact button that directs you to the [email protected] email.
Map Navigation
Hover your cursor over a button to activate a tool tip and identify the name of the tool or button function.
Info button

The info button opens a window containing information about FINDER Online. It includes links to various resources, browser recommendations, and contact information for questions.
Search

Use this tool to find a location by typing in a property address or parcel account ID. As you type, a prompt may appear. Parcel account IDs should be the entire unique ID number with the two-digit county code. The formatting of parcel account IDs varies by jurisdiction. More information about these can be found here. Use a space between Block and Lot when for Baltimore City if the Block is less than five characters. You may use the drop-down menu to the left of the text box to search by address, parcel account, or both.
For keyboard navigation, use the arrow keys to access the search results as they appear. If you click the magnifying glass icon, tab through the rest of the map tools to return to the search results.
Zoom

Use this tool to interact with the viewing extent of the map window. Clicking the + button will make the map subject area large scale (i.e. “zoomed in”). Clicking the – button will make the map subject area small scale (i.e. “zoomed out”). This function may also be accessed using a mouse scroll wheel.
Default Extent

Click this button to return the map frame extent to the default statewide view.
My Location

Click this button to allow your browser to request location access. The map frame view extent will update to reflect the user’s geographic location by IP address.
Sidebar Tools
Hover your cursor over a button to activate a tool tip and identify the name of the tool or button function. The following tools appear from top to bottom in the left sidebar.
Legend

The Legend tool displays the symbology of layers that are visible on the map.
Layer List

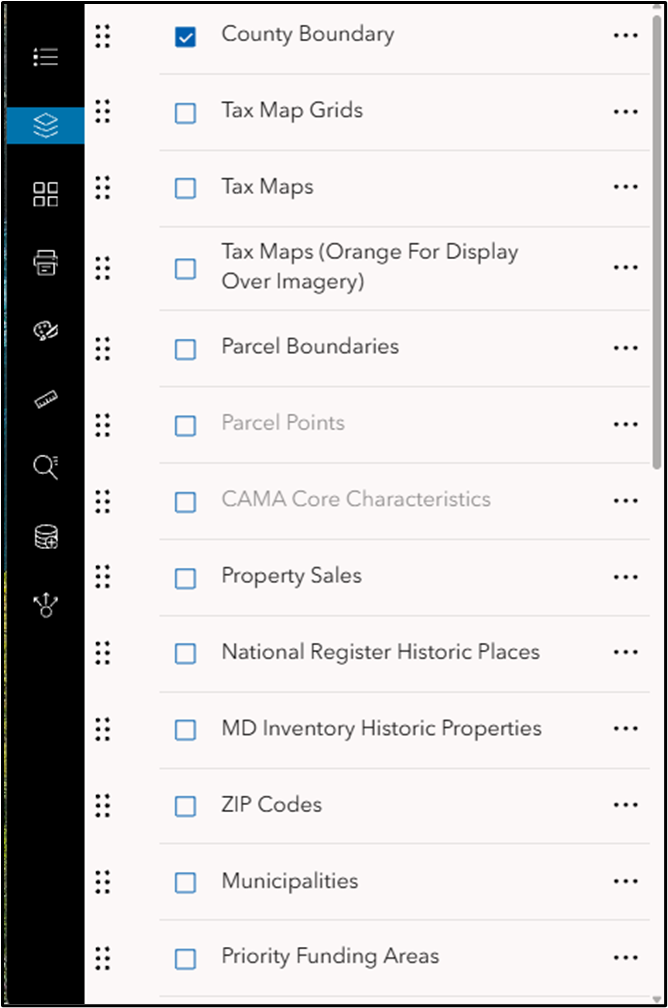
The Layer List tool turns layers on or off (i.e. displaying or not displaying them on the map). Click the box to the left of the layer name to turn it on or off. The County Boundary, Six Inch Imagery, and World Street Map layers are on by default. Scroll down through the layer list to view all available layers to display. Additional layers are listed in the Data Sources section of this document.
Some layers contain additional sublayers. Click the arrow to the left of a layer name to expand. If you wish to display sublayers, the layer group name must be checked on. By clicking the arrow to the left of some layer names, symbology information may appear.
If a layer name appears grey, it is not visible at the map’s current scale, and you may need to zoom in or out to see it. For these layers, you can change the visibility range (see below). You will need to zoom in for some to appear, like the Tax Map layer, even though their layer names do not appear in grey.
Clicking the three dots to the right of a layer name provides additional options. You can change the transparency of a layer, zoom to the layer, or set its visibility range. Change the display order of layers by clicking on and dragging the six dots located to the left of the layer name.
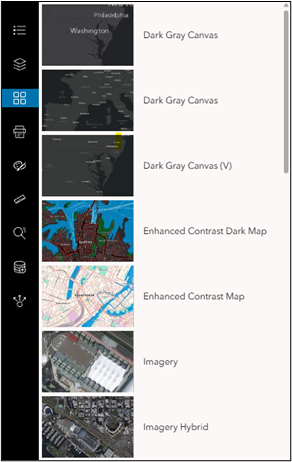
Basemap

The Basemap tool lets you change the basemap that appears underneath the data layers. Select from the options listed to change the appearance.
Print

Clicking on the Print tool will open the Print menu. The menu asks the user to enter a Map Title, choose a Layout size, and File Format type. The output extent of the map is dependent on the layout size and centers the current extent of the map frame.
The user can further customize the map output by clicking the Advanced button. When you have finished customizing your settings, click the Print button. You will see a “Creating print” graphic while your print is being prepared. When the print has finished generating, it will appear in the Results tab.
The time needed to generate the print may vary. This depends on the size of the area being printed and the number of layers turned on. Internet speed can also be a factor in generating prints. If print generation takes too long or fails, retry, or see if reducing the area or layers printed helps.
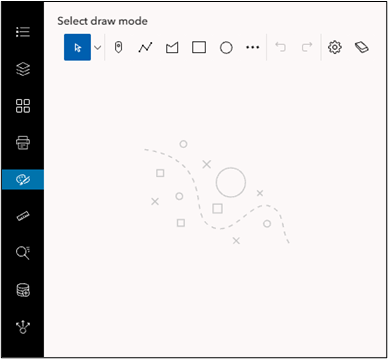
Draw

The Draw tool is useful for marking up a map before exporting a printout. Clicking on the Draw tool will open a tab with several drawing modes. Hover your cursor over the button to see its name. Some drawing modes may have further options to change the appearance of your drawing. After previewing a sample, you may click on the map to place your object or begin drawing. You can undo, redo, clear, and change the settings for your drawing. Use the select option to select, move, resize, or edit your drawing. Clicking a selected object lets you edit its vertices.
Use the Esc key to exit drawing mode. You can also use your Delete key to delete selected objects.
Measurement

This tool allows the user to measure a distance or area. Click on the map to draw a line or polygon, and the corresponding measurement will appear in the sidebar. The user can select from a dropdown of measurement units. To finish your measurement, double click with your mouse. Click Clear measurement to remove your results from the map and the sidebar.
The measure tool supports several keyboard navigations as well. With the Distance or Area tool active, hover your cursor over the map and use the F key to add a point to your measurement. Use the Z key to delete the last point placed and press Enter to finish the current measurement.

Select

The Select tool allows the user to select three types of features. These features are Parcel Points, Property Sales points, and CAMA Core points.
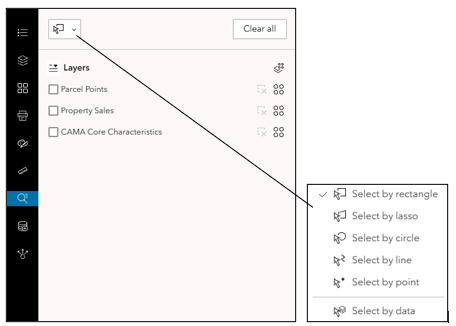
Open the Select tool. Check the boxes for Parcel Points, Property Sales, or CAMA Core to enable the layers for selection. Use the drop-down menu in the top left to choose a method for selection. The select by data option allows you to select points by clicking them on the map. The other options allow you to select by several different shapes. Since you are selecting points, it is best to select by rectangle, lasso, or circle. Click and drag your mouse on the map to draw a circle or rectangle, and let go to finish drawing. For select by lasso, click and drag to draw a shape freehand or click multiple locations to draw a polygon. Double click to finish the drawing. All features for the layers enabled for selection in your drawing will be selected.
You can apply an action to the selection across all layers using the Actions button. Apply an action to the selection for a single layer using the Actions button next to a layer. Clear the selection for a single layer using the button. Clear the selection across all layers using the Clear all button.
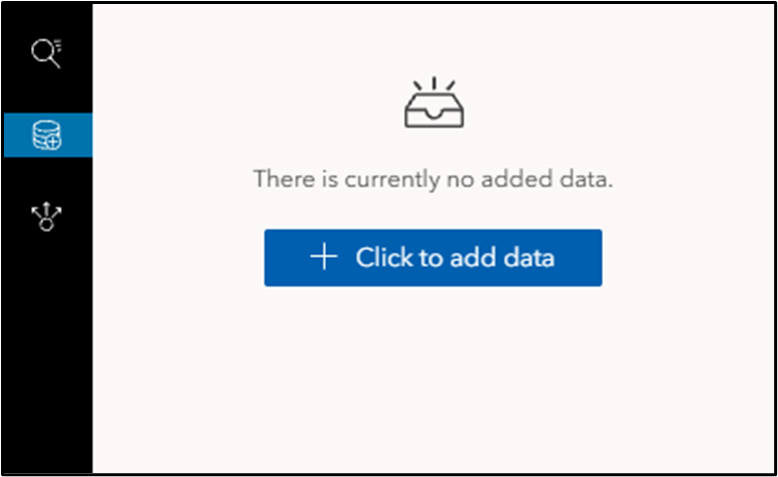
Add Data

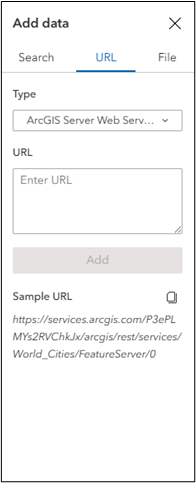
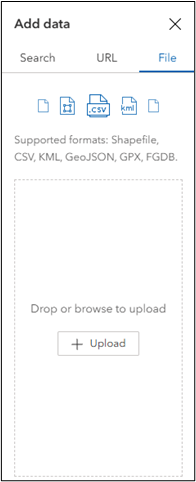
The Add Data tool lets you to add additional data (temporarily) to your FINDER Online session. You can search for data on ArcGIS Online, add data via a URL from a web service, or upload a file.
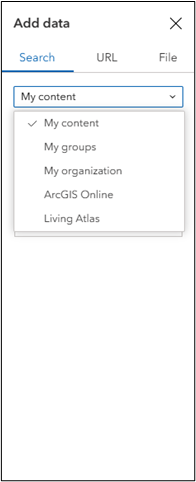
You can choose data from your content, your groups, or your ArcGIS Online organization. You can also choose from all public content on ArcGIS Online or content from the Living Atlas.
If you are adding a URL, see the “Sample URL” in the sidebar for an example of what the URL should look like. You may find URLs for MD iMAP services here. MD iMAP imagery services are located here.
Add data using one of the file types listed in the tool. You may either browse to a location on your computer or drag and drop a file to upload. There is a maximum of 1,000 features that can be added from a file.
Share

The Share tool allows you to share FINDER Online in several ways. You can share the application via link, QR code, email, or link to embed FINDER Online into a website. The link will preserve the location and layer visibility from your session.
Data Viewing and Export
Pop-Ups
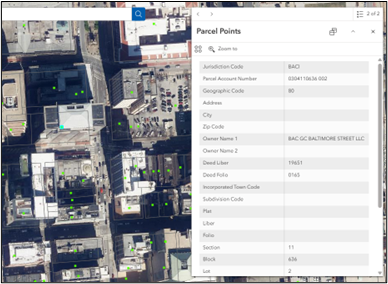
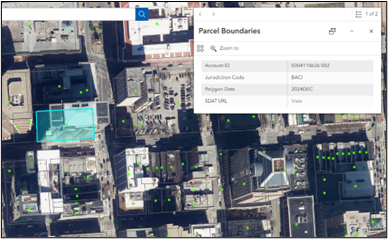
Click on the feature in the map and a pop-up window will display attribute data for the selected feature. If you select multiple features, arrow buttons will appear in the pop-up. Use the arrow buttons to page through the pop-ups for multiple features. In the example above, there are two available pop-ups.
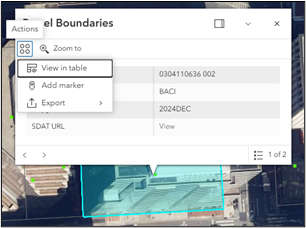
The pop-up includes several options. You can zoom to the selected feature or view the feature in the Attribute Table. You can also add a marker on the selected feature, or export the selected feature as a JSON, CSV, or GeoJSON.
Attribute Table

Click the tab at the bottom center of the map frame to open the attribute tables for the following layers:
You can view these tables whether or not those layers are currently displayed in the map frame. Additional layers and features can be viewed in the Attribute Table.
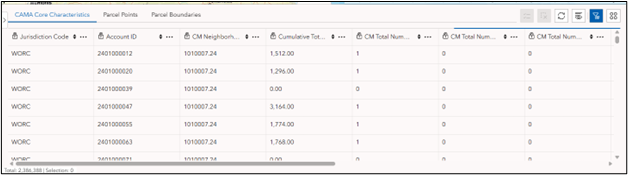
There are several options within the Attribute Table. These include buttons to refresh the table, show/hide columns, and filter by the map extent. The Actions button has additional options. You can set a filter, calculate statistics, zoom to, pan to, and export the table as a JSON, CSV, or GeoJSON.
You can select a feature by clicking on it in the table. Additional options appear along the top bar of the table for selected features. You can display the selected features in the table and clear the selection.
The Actions button includes additional options for the selected features. These include calculate statistics, zoom to, pan to, show on map, view in table, add market, and export.
Data Sources
The list of source data used for each layer or layer group is provided below. The links contain further information about the data.
County Boundary
Tax Map Grids
Tax Maps
Tax Maps (Orange For Display Over Imagery)
Parcel Boundaries
Parcel Points
CAMA Core Characteristics
Property Sales
National Register Historic Places
MD Inventory Historic Properties
ZIP Codes
Municipalities
Priority Funding Areas
Rural Villages
Generalized Sewer
Protected Lands
Land Use (2018)
Generalized Zoning
Census Boundaries (2020)
District Boundaries (2022)
Floodplains
12 Digit Watersheds
Broadband Service Areas
Three Inch Imagery
Six Inch Imagery
NAIP Imagery
USGS Topo Quad Maps
Tutorials
Examples of some uses for FINDER Online
CSV Export of Parcel Account Selection
Goal: Create a .csv file of parcel accounts located within a Census Block
