Maryland’s Indicators
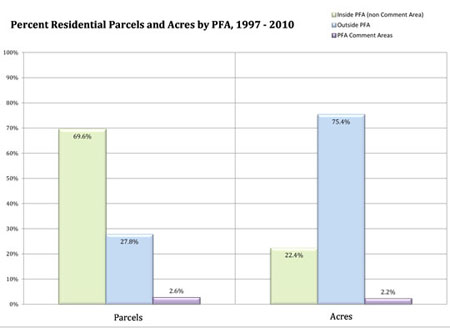
Since 1997, nearly 70% of residential parcel growth has occurred inside Maryland’s Priority Funding Areas (PFA). This residential parcel growth accounts for fewer than 23% of the new developed acres during the same time period. Conversely, only 27.8% of the state’s residential parcel growth has occurred outside the PFA. Despite this small share of residential parcel growth, residential development outside the PFA accounts for more than 75% of new developed acres.
(Click on graph for larger view)
This chart illustrates the percentage of both residential parcels and residential acreage in three different areas: Priority Funding Areas, Outside PFAs and PFA Comment Areas. Here it is important to note that parcels outside PFAs, though fewer in number than inside PFAs, have consumed a larger proportion of acreage compared to parcels inside PFAs. The average parcel size inside the PFA is approximately 0.25 acres, while the average parcel size outside the PFA is approximately 2 acres.
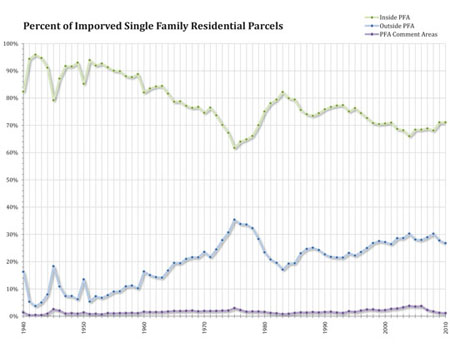
To track residential development trends in Maryland, MDP’s Planning Data and Analysis Division created a consistent geospatial database of improved single-family residential parcels of 20 acres or less from 1940 thru 2010. This "mapped" database is used to analyze residential development trends inside and outside of Priority Funding Areas (PFAs) across the 70-year time span. (For more information about PFAs, see the Local Government Planning Frequently Asked Questions.)
Maryland has experienced a relatively flat trend in the share of improved residential parcels developed inside of PFAs since the implementation of Smart Growth laws in 1999. The most recent years with available data show an uptick for improved residential parcels inside PFAs. These are also among the lowest shares observed since 1999. In 2009, the share of improved residential parcels inside PFAs surpassed 71% for the first time since 1997. In 2010, this percentage remained above 71%. These latest observations are important to note although not necessarily indicative of a solid trend.
(Click on graph for larger view)
This chart shows the trend of residential parcel locations with respect to the Priority Funding Areas
between 1940 and 2010. This graphic illustrates the decline in residential parcels located within PFAs over time.
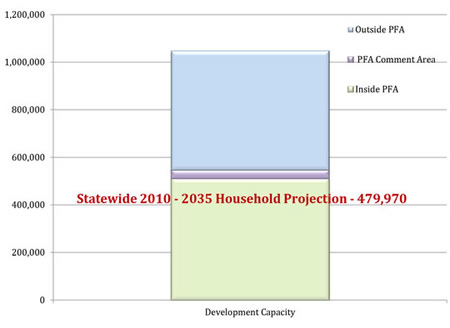
MDP maintains an analysis of statewide residential development capacity, or land supply, inside and outside the PFAs. Under current programs (i.e., zoning, water and sewer plans), it is estimated that all of the state’s projected growth from 2010 to 2035 could fit within existing PFAs. While it is not realistic to assume that 100 percent of new growth will go inside PFAs, this analysis demonstrates that PFAs could be used more efficiently to accommodate a larger share of future growth.
For more detailed information:
Maryland State Data Center: Tracking Residential Growth -- Priority Funding Areas (PFAs) and Residential Single-Family Development in Maryland, 1940-2010
(Click on graph for larger view)
This chart presents the estimated development capacity - that is, land supply in Maryland - within three different areas: PFAs, PFA Comment Areas and Outside PFAs. It also shows the 2035 projection for Maryland of nearly 500,000 households. Sufficient capacity exists within PFAs to accommodate all of the state’s projected growth to 2035.
Summary of Local Jurisdictions’ Annual Reports
As stated above, the 2009 Smart, Green & Growing legislation requires MDP to report on smart growth goals, measures and indicators submitted by jurisdictions in their calendar year annual reports. These required indicators provide an annual snapshot of the location and intensity of development in relation to the state’s identified investment areas, Priority Funding Areas (PFA), along with remaining development potential and locally generated agricultural land preservation. These indicators are useful in assessing the amount, location and intensity of growth occurring inside or outside of PFAs.
(Click on graph for larger view)
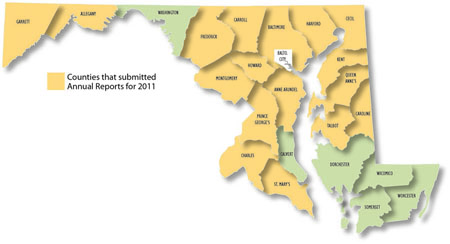
The year 2012 marks the third year these annual reports have been submitted. Annual reports are to be filed by each jurisdiction by July 1 and are to include data from the previous calendar year, thus the reporting period for these reports is calendar year 2011. In 2012, the Maryland Department of Planning (MDP) received 66 annual reports for calendar year 2011, including 17 of the 23 counties and 49 municipalities. This is twice the amount of annual reports received for calendar year 2009 (33), but fewer than the 74 received for calendar year 2010. MDP staff will continue to streamline the annual report process, assist local jurisdictions and improve the quality of the reports.
 Jurisdictions issuing more than 50 new residential building permits within the calendar year must provide additional data on prescribed measures and indicators, which includes the amount, net density and share of residential and non-residential growth inside and outside of a PFA; the locally adopted land use percentage goal; and the amount of any locally funded agricultural land preservation. Of the 17 counties reporting, three counties had fewer than 50 permits. Eleven counties reported their growth both inside and outside of their PFAs while two of the counties with more than 50 new residential permits did not. Of the 49 municipalities reporting, only 3 reported more than 50 new residential permits for the reporting period.
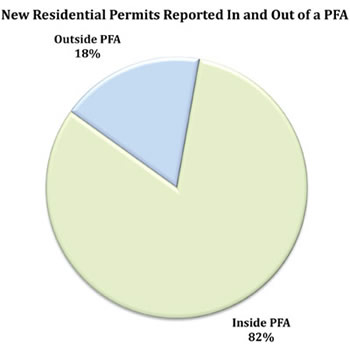
Counties reporting new residential building permits inside and outside of their PFAs demonstrated mixed results for the reporting year. Only Anne Arundel reported 1,500 or more new residential building permits for the year 2011 with 2,341 new residential permits of which over 94% are within the PFA. Other notable counties include Harford with 90%, St. Mary’s with 83%, and Prince George’s with 74% of new permits within their PFAs. Garrett County reported 1 new residential permit inside and 80 outside of its PFA boundary (only 1.2% of residential growth inside). Charles County reported 34%, or 460, of new residential permits inside its PFA and Kent reported 35%, or 20, of new permits within its PFA.
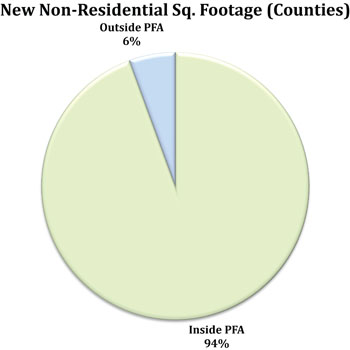
 As most jurisdictions report the amount of permits approved, some jurisdictions have combined permits with units, making it difficult to report an accurate permit total. Staff is working with jurisdictions to clarify the information provided for future Annual Reports. Acknowledging this limitation of the data, it is estimated that a cumulative total of 9,707 new residential permits were approved in 2011 by the 60 jurisdictions submitting Annual Reports. Of the 13 county jurisdictions reporting the number of new residential permits both located inside or outside of the PFA, approximately 80% of all new residential permits were approved within PFA areas. Non-residential development was also reported by counties and municipalities. Reporting counties had 5,714,809 square feet of non-residential development. Reporting municipalities had 687,888 square feet of non-residential development. Of the counties reporting the total amount of non-residential development approved within PFAs was approximately 94%.
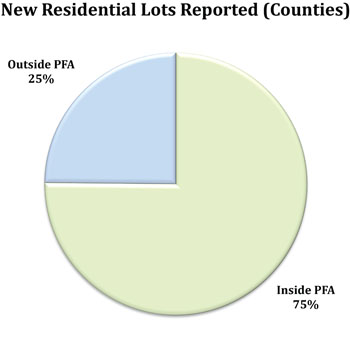
Counties reporting their share of new residential lots created inside and outside of PFAs also demonstrate mixed results. Anne Arundel, reporting more than 1,000 new residential lots for the year, created 1,076 new lots of which just over 91% were located inside its PFA. Other notable counties include Prince George’s with 98%, Garrett with 96%, and Harford with 82% of new lots inside their PFAs. For all reporting counties that provided development data inside and outside of PFAs, 2,235 new residential lots were created inside PFAs of a total of 3,709 lots for a share rate of over 60%. Reports of new residential building permits showed that of the 6,340 new residential permits reported, 5,094 were inside PFAs for an 80% share rate.
 Back to top
