D. Nonpoint Source Loading Analysis
Expectations for the Loading Analysis
Expectations for the analysis are threefold:
Simple before-and-after nonpoint source loading analysis for nutrients
The state will provide a default methodology spreadsheet upon request. Local governments may use this method, refine this method, or use their own method provided that assumptions are justified and sources of information are documented. There is no specific loading “target” or “right answer” for this preliminary level of analysis. The minimum expectation is that a good faith loading analysis be conducted to assess the change in nutrient loads in relation to projected land use changes and potential BMPs, such as septic denitrification. Changes in open space (forest and cropland) and impervious cover may also be assessed.
Reasonable assurance that alternative land use options have been considered
The expectation is to explore a variety of innovative planning techniques designed to protect water quality, e.g., directed growth and down-zoning, Smart Growth, transfer of development rights (TDR) ordinances, cluster development (e.g., shared driveways), increased densities, maximum limits on parking spaces or related impervious footprint, etc. This can be documented in supplemental information provided with the WRE for review by MDE.
Discussion of Future Steps
This analysis is expected to be preliminary. The documentation should include recommendations for ensuring that future loading analyses are systematized within local government planning and decision-making procedures.
The spirit of this analysis is to assess how planned growth within a local jurisdiction might affect nonpoint source loads to receiving waters. This is not an easy or straightforward task: questions of scale, land use definitions, pollutant loading rate assumptions, planned versus projected growth trends, among others, present a host of challenges.
Policies and tools for assessing nonpoint source loads are in transition and changing rapidly. This guidance initiates a process that is sufficiently flexible to begin addressing the need for meeting implementation goals of local TMDLs as well as Chesapeake Bay loading caps. Although the current analytical method in this guidance is not intended to solve the TMDL implementation puzzle or achieve the Chesapeake Bay Tributary Strategies, it represents a bridge to achieving those goals.
The Chesapeake Bay community is actively investing state and federal resources into the development of the Phase 5.0 Chesapeake Bay Watershed Model, managed by the Chesapeake Bay Program. This tool and its components, such as assumptions about land use loading rates and BMP efficiencies, will help to resolve many of the present challenges related to scale and land use. This Phase 5.0 model will be used to develop future nutrient TMDLs for many of the larger tidal rivers in Maryland as well as the Baywide TMDL that will be completed in about 2011.
Lessons learned and data generated through the WRE nonpoint source loading analyses may generate valuable information to be used as inputs to the Phase 5.0 Chesapeake Bay Watershed Model. In addition, current efforts to build Tributary Basin Implementation Plans provide an opportunity for local governments to ensure that the construction of the Chesapeake Bay TMDL technical framework is based on the best available local data. Recognizing this in the context of the WRE analyses provides the incentive for state and local governments to shape future polices and technical tools. This will help ensure Maryland’s ability to grow in concert with its demand for healthy, vibrant rivers and Bay.
Technical Guidance
There are two options for conducting this analysis:
- Work with the Maryland Department of Planning to perform future growth and land use pattern projections using their Growth Model; or
- Use a local growth projection model. (If a local growth projection model is chosen, information and methodology used should be provided for review.)
In either case, the general goal is to determine an initial estimate of land use/cover and future land use/cover 1. Then, determine the change in nonpoint source nutrient loads due to the change in land use/cover. For those who choose option 1, working with the Maryland Department of Planning Growth Model, the load estimation can be conducted using a spreadsheet developed for use within that context (available upon request fromMDE). For those who choose option 2, technical assistance is available from MDE uponrequest. Alternative loading analysis methods may be used, provided that assumptions are justified and documented.
The steps outlined below should be conducted for a variety of land use planning alternatives.
1.Estimate Initial Land Cover and Septic Systems
As a default, MDP 2002 land use information can be used for initial land cover.
2. Estimate the Future Land Cover and Septic Systems
Use the MDP Growth Model (or other accepted method) to estimate future land use patterns and the number of equivalent dwelling units (EDUs) over a specific time horizon. This step may be repeated for alternative land use configurations that consider different zoning options, rural protection programs, physical constraints (e.g., hydric soils or steep slopes) and alternative assumptions about the availability of water and sewer service. The MDP Growth Model will compute the future land use areas for those that employ the state’s technical assistance.
The MDP Growth Model will provide an estimate of the number of future residential septic systems by determining which future dwelling units will not be on county or municipal sewer. This necessitates that sewer planning areas be identified. Those who do not use the MDP Growth Model will likely need to use GIS techniques to estimate the numbers of EDUs on sewer versus septic systems.
3. Estimate the Nonpoint Source Nitrogen and Phosphorus Loads for Initial Land Cover
A. Using average annual loading rates, by land use type, multiply the acres of each land use by the corresponding loading rate. Sum these loads by land use type to derive a total average annual load.
B. Using the best available information for the number of existing septic systems, the following formulas are used to estimate the current septic system nitrogen loads (zero phosphorus loads are assumed from septic systems).
Individual Systems:
Number of individual systems x # persons/household2 x 9.5 lbs/person/yr x 0.4
Where 0.4 is the transport loss factor used by the Chesapeake Bay Program.
Shared Residential Systems: This is addressed implicitly by using the calculation above and multiplying by the number of EDUs.
Non-Residential Septic Loads: (Commercial, industrial, institutional systems(e.g., public schools, public hospitals, etc.)) To calculate non-residential septic loads, a series of three simple equations is presented below that provide rough estimates of non-residential nutrient loads from septic systems.
1) Acres of Non-Residential Land on Septic x Avg. Flow/Acre = gallons per day (GPD)
2) GPD/1,000,000 = Millions of gallons per day (MGD)
Then, using the total MGD just found, plug into:
3) MGD x 40 mg/L of N x 8.34 x 0.4 x 365
Table 3 below provides the estimated average flow per acre based on the type of non-residential land use that is needed in the equation above. Table 3 below provides estimated average flows per acre based on the type of non-residential land use that is needed in the equation above. Local governments may have a better idea of local industry flows and those numbers may be substituted for those in the following table.
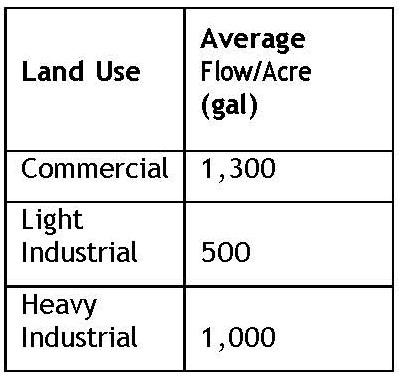
Table 3. Average Flow in Gallons by Land Use
Source: www.aacounty.org/PlanZone/MasterPlans/WaterSewer/Index.cfm. Reference the last page of Appendix A.
4. Estimate the Nonpoint Source Nitrogen and Phosphorus Loads for the Future Land Cover
A. Using average annual loading rates, multiply the acres of each land use by the corresponding loading rate. Sum these loads by land use type to derive a total average annual load.
B. Using the best available information for the number of future septic systems (from Step 2), estimate the future septic system nitrogen loads. An alternative option for using denitrifying septic systems could be explored as part of the analysis.
C. The amount of forested land may be adjusted to account for various conservation options. Any changes in forest cover, however, should be documented and justified.
5. Compare the Initial Loads to the Future Loads
Compare the initial and future loads (by state basin or countywide) in conjunction with an analysis of future increases in WWTP nutrient loadings as a result of future land use changes. WWTP, septic tank, and nonpoint source loadings from future development all should be considered together to assess the comprehensive impacts of land use changes. The MDP Growth Model projects the amount of future development that will use WWTPs versus septic tanks. Nutrient loadings from WWTPs will depend on the nutrient removal technology of the existing or proposed WWTP providing service. (The NPS spreadsheet mentioned above will also include point source load estimation worksheets. This is available upon request from MDE).
Ideally, the future loads should be less than the initial loads. If the future loads are greater, consider land use alternatives (e.g., greater densities, and different patterns or locations of development), spray irrigation of wastewater, and nutrient offset projects (e.g., forest preservation and restoration). Assess potential sources of uncertainty in the analysis that could be refined as part of the WRE analysis or in the future.
Supporting Information and Tools
-
MDP 2002 land use/cover in GIS
- Table of standard percentages of impervious cover by MDP 2002 land use category (see Table 4 on the following page)
- GIS coverages of state basins
This GIS coverage is also available from MDE upon request. - Default estimates of the number of existing and future septic systems by County and state basins
- The future numbers can be provided as an output of the MDP Growth Model.
- Average number of people per household, provided as a worksheet on the Maryland Department of Planning website
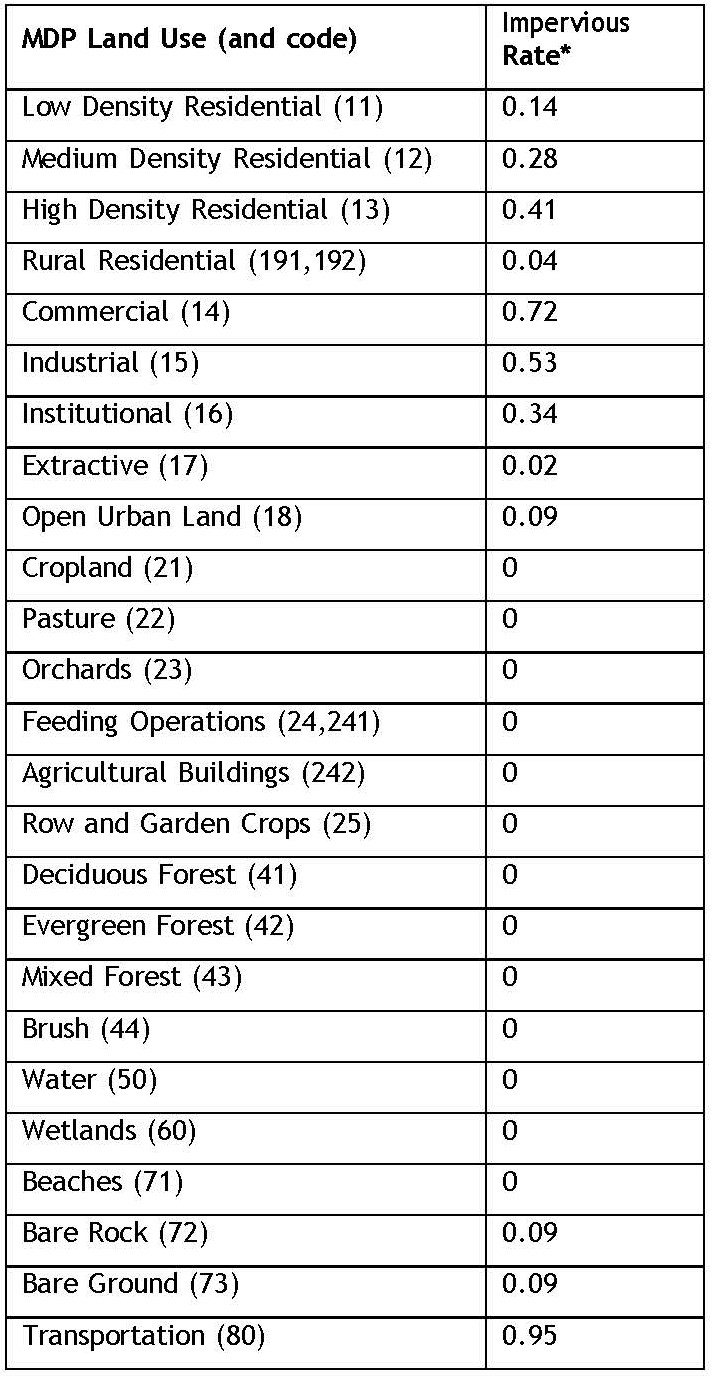
Table 4. MDP Land Use and Center for Watershed Protection’s Impervious Rates
Source: Cappiella and Brown,
Urban Cover and Land Use in the Chesapeake Bay Watershed, Center for Watershed Protection, 2001, as referenced in Table 4.1 of a
User’s Guide to Watershed Planning in Maryland,
https://dnr.maryland.gov/ccs/Documents/Users-Guide-watershed-planning-MD.pdf
1 The “future” land use/cover will depend on the local land use plan, zoning, rural protection programs (e.g., purchase or transfer of development rights), availability of water and sewer service and time horizon of the analysis.
2 The 2000 census value of average number of people per household, provided by the Maryland Department of Planning (HHsize_Proj05.xls) can be found on the MDP website.
