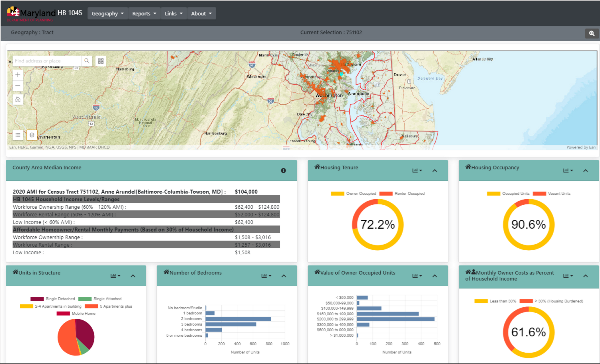
Data Dashboard
The Housing Mapping and Data Dashboard consolidates housing supply and needs data into comparable geographies to aid jurisdictions with local analyses for housing planning. By selecting an entire or a portion of a jurisdiction, local planners can assess current housing characteristics and influences and consider future housing needs based on affordable housing demand and supply. Affordable housing strategies should be targeted and adjusted to fit local geography and areas of need. The dashboard uses currently accessible data but Maryland Department of Planning (Planning) staff will include additional housing data as it is developed or updated. Planning strives to make as much data as possible available at the census tract, incorporated place, census designated place, and county levels. Census tracts do not nest within municipalities but depending on the overlap with municipal boundaries and municipal growth boundaries, may provide data at a geographic level sufficiently refined for neighborhood or small area planning. For assistance with the American Community Survey (ACS) data on the Dashboard or more generally, please contact Al Sundara, Manager, Projections and State Data Center, at alfred.sundara@maryland.gov.

Planning has curated data sets that give insights into current housing supply and demand, which can help spark new conversations about housing innovations. Using supply indicators, one can ascertain housing stock diversity by looking at the types and sizes of structures, based on the number of bedrooms, the variety of housing values and monthly rent costs, and homeownership and rental levels. Planning has included a breakdown of Selected Monthly Owner Costs as a Percentage of Household (HH) Income (with mortgage) and ‘Gross Rent as a Percentage of HH Income’ to demonstrate housing burden. The impact of housing burden has been felt acutely during the COVID-19 pandemic and can be looked at as a component of a community’s resiliency, especially at the low income and workforce levels.
ACS data can also show the composition of your community, highlight unique housing needs, like households with seniors or children, indicate which income levels certain households reflect, and how people are getting to work. These data can also inform strategies for attracting future residents by providing housing opportunities and linking housing to other planning considerations, such as multi-modal transit centers, available infrastructure, local employment, and community amenities, including recreation and open space.
The dashboard also includes other mapping layers as overlays, such as Priority Funding Areas, sewer service areas, parcels, and state and federal designations such as Sustainable Communities, Enterprise Zones, and Opportunity Zones.
To learn more about how a jurisdiction can use data from this dashboard in a local housing needs assessment, please see the Model Housing Element Development Process section of this Models and Guidelines.